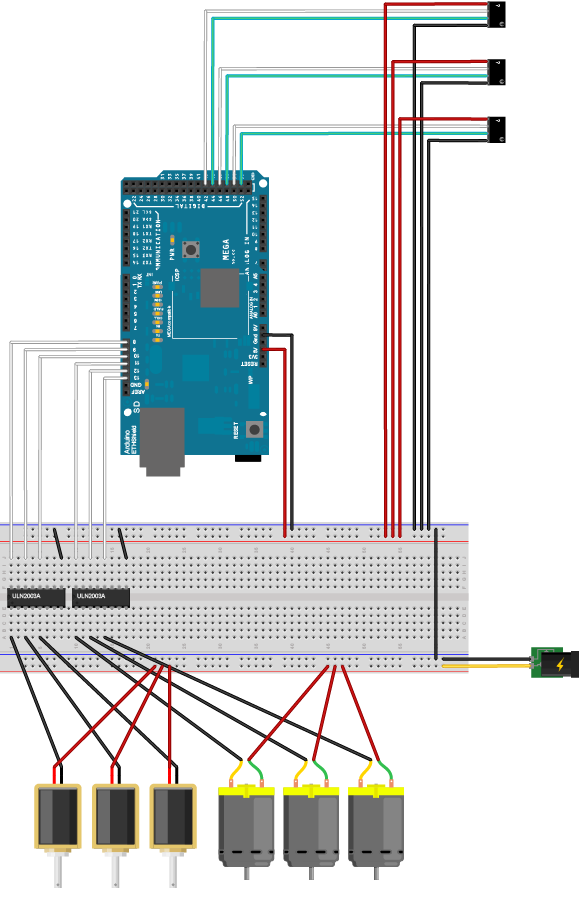
An early diagram of the wiring for the project. The ULN2003As were later replaced with relays which can safely handle more current.
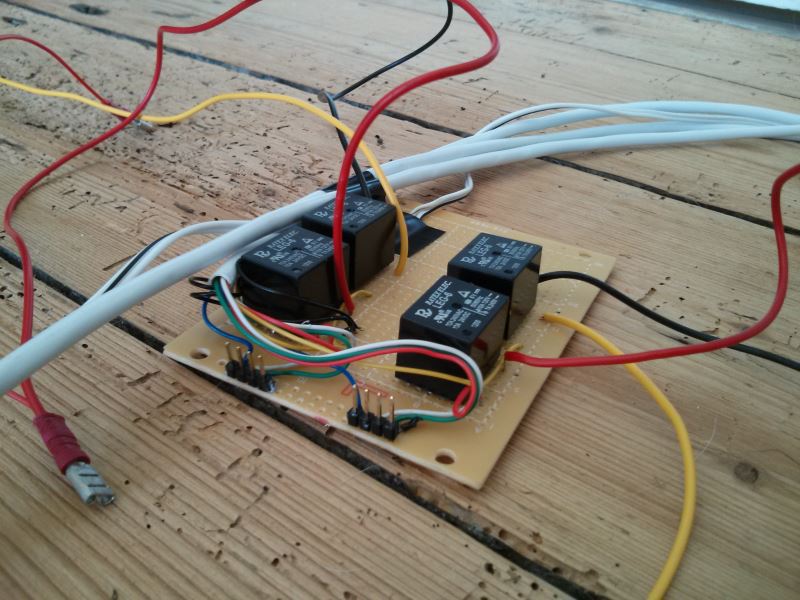
An early diagram of the wiring for the project. The ULN2003As were later replaced with relays which can safely handle more current.

Exterior designs for the unit.
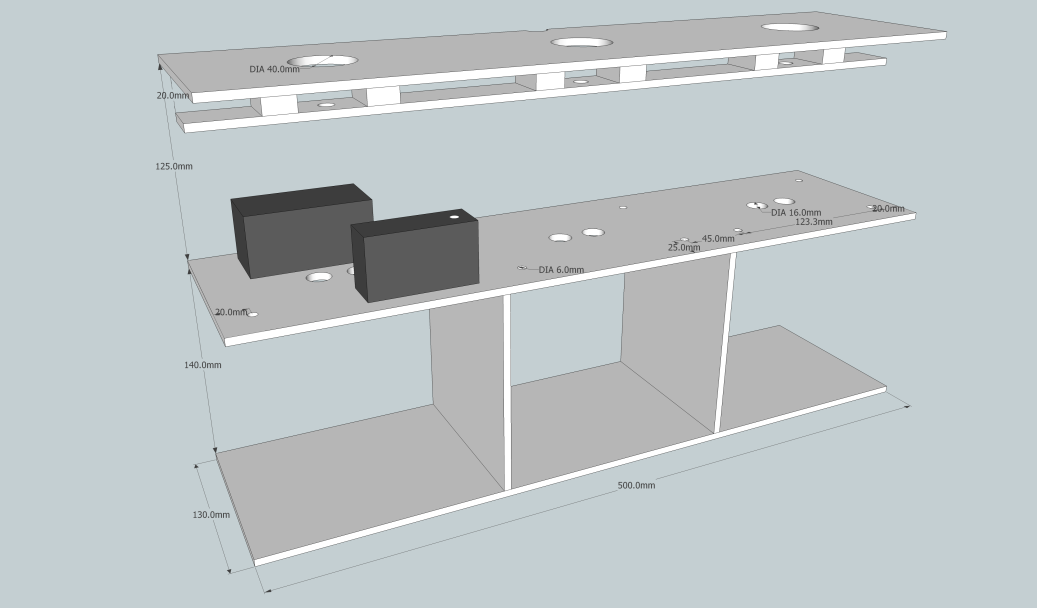
A plan with dimensions for the acrylic pieces to be cut.
![]()
Testing sending events and matching seeds.
Testing audio visualisation and cross window support.
Audio cross screen visualisation, offsets.
Directional sound pitch matching test.
Development Gource
http://tweetflu.co.uk
http://tweetflu.co.uk/backend
Backend running
Research:
– Simon Batty
– Jo Redwood
Web Design:
– Simon Batty
Clientside Development:
– Simon Batty
Daemon Development:
– Jo Redwood
Serverside Development:
– Jo Redwood
Conceptual Presentation:
– Simon Batty
– Jo Redwood
Demonstration
– Jo Redwood
– Simon Batty
Mind’s Eye was a very technically challenging project to complete. We started with an general understanding of some of the core principles that would be fundamental but we had a long way to go.
As the main programmer of the group I focused on these problems, here is an overview of the main challenges that we faced.
One of the technical challenges we had to face was to run the same visualisation across all displays and computers. Fortunately random numbers in computing are not random at all, just pseudo-random and therefore predictable and repeatable. Random number generators tend to use a ‘seed’ value which acts as the starting point for the numbers generated. Some of these generators let you set the seed value and so providing all the clients fetched the same number of random numbers, they will result in the same sequence. By sending the same seeds to the clients and having the clients run the same code the random effects generated will be identical. We set the seed to the pitch of the sound being visualised which had a good effect.
Another problem was that if the framerate of one of the clients dropped, it would fall behind the others. Because the position is updated each frame a client dropping frames like this the particles would appear to be moving more slowly. Processing provides a variable called ‘frameRate’ which is the number of frames per second. This variable is calculated over a number of frames so if the framerate has dropped it is already too late to do anything about it. We could raise the target framerate to catch up but it would be likely that since it’s currently struggling to reach the existing framerate it could be a while before it would be possible to catch up so there would still be significant jumping.
The way around this is to separate the code for controlling the position and the code for drawing it and not drawing anything when the frame rate is low. This leads to another problem of flickering. The frames actually drawn are all correct and the particles are moving at the correct speeds but we needed a way to avoid this. The solution was to create a timer each frame then only draw particles if they fall within the available time budget for the frame, this way only some particles will be skipped and the position calculations can carry on at 30 frames per second.
To display on multiple computers we needed to share data via a network connection. To achieve this we had two options. The first was to send data for each particle between the computers, the problem with this is that we wanted a large number of particles to be displayed at once and this would create significant network traffic between them. The other solution was to make use of the random seeds and only send a message for each ‘event’ and let each computer work out where the particles should be.
Originally we used IBM’s MQTT but having been designed for robust, high latency messaging we found it too slow for our purpose of visualising live sound at least with the implementations available to us. Instead we opted to use processing’s net library to send events via TCP. The alternative would have been to use UDP which is faster but unlike TCP it is not as reliable and does not ensure delivery. Each message was made up of a serialised JSON object containing various properties for the event including pitch, amplitude, it’s position in virtual space and an unique identification for the client.
In this visualisation we needed to run different bits of code at different intervals and keep track of the age of things so a timer object would be necessary. In processing we can use the default Java timers based on the system clock however since it had to run completely identically to other clients even a small framerate delay could seriously impact the timing and cause it to desynchronise. So the only way to ensure that it was entirely deterministic was to count the number of frames and work from that.
To detect sound we used the Minim library and its FFT class. We detect the pitch with the highest amplitude and add it to an array of a tweak-able length, this smooths the output. At a regular interval it checks if it has exceeded a threshold and if it has then create an event based from it.
Each visualisation object is generated from an event sent from the server. The visualisation object then creates particle objects moving from its origin, once a particle reaches the end of its life it is removed and replaced unless the visualisation itself has passed its own duration and is finishing. It does this so that if a visualisation finishes it doesn’t suddenly remove all its particles, it instead just waits for all the existing ones to expire before telling the code cycling through the visualisations that it is ready to be removed.
The code has a ‘Visualisation’ class allows for multiple types of visualisation to be created, it is passed the data for the visualisation and the type of visualisation then acts as a bridge to and from the specific visualisation.
For the visualisation to be effective effects had to be displayed as close to the source of the sound as possible. To do this the clients send their detected sound events to a central server which compares incoming events against each other and attempts to find cases where the pitch matches, assuming that two sounds at the same time and same pitch have the same source. It then uses the amplitude of the the two sound events with linear interpolation to determine the position between them. The server then removes the original events that matched from an array and adds a new one with the calculated position. After all of this it cycles through the events and broadcasts them to the clients.
To map the virtual space to the physical and allow the natural movement of things from one screen to another there were a number of challenges.
Before even working on cross screen support we first worked on cross window support as for full portability it had to be possible to run the client in a window also allowing for multiple clients to run on a single computer. The sketch makes use of the scale and translate functions to zoom in and show the correct portion of the full virtual space.
For mapping multiple different physical screens to the virtual space the sketch has to first calculate the pixel density of the screen, unfortunately this isn’t possible to find out in software reliably. To work around this the user must set the diagonal size of the screen in inches, inches are used for this just because screens are still most commonly measured in them. The screen’s aspect ratio is calculated from its resolution and with the monitor size the physical width and height of the monitor and then the pixel density can be calculated. With the pixel density the sketch scales so that everything is the same physical size independent of display. Along with this the user must also set the screen’s offset from another which is measured in metres and the microphone offsets for determining the source of the sound relative to the screen. Out of this came a scale of 10 pixels per centimetre.
Tying it back into physical space in this way had some strange effects such as it being possible to measure network delay in centimetres. It is strange that we seem to have disconnected from physical dimensions in computer interfaces and environments.
This was a really good project to work on as I have always had an interest product design and development and also have ambitions to start my own company. The project served as an exercise in creating an idea and turning it into a business.
Temperamental was based on the an earlier project from another module which looked at it conceptually rather than as a product. I didn’t want to waste what I thought to be a potentially good idea and carried it over and developed it from there. Having been unable to attend a few early lectures I fell behind but I was able to catch up towards the end. At one stage I was not confident with the idea and was considering changing it. The problem I was having was that I couldn’t settle on the idea because I could potentially come up with a better one. I decided to cautiously continue with my initial idea which as I was working on it, became more complete and I became progressively much happier with it.
The main strength of the product is in the novelty and humour aspect that makes it a good gift. It’s not directly useful in it’s primary role as a toy but it does have secondary functions that could be useful to people. The gift market is huge and this kind of product is hugely popular, this product would seek to target the higher price range within this novelty, compulsive purchase space. The electronics technology involved is relatively simple and the bulk of the cost of the product to produce would be spent on the finish and feel of the product. The product incorporates a game-play aspect in that while it has been made happy by matching the environment it wants it can increase the owner’s score on their website profile. This gives the product a longer life than just the initial novelty.
The secondary function is as an indoor weather station. Devices connected via USB to computers running some software would be able to send data to the website. This would allow logging as well as sharing the user’s score. Users could choose if they want to publish their live data publicly and this would be added to a set of maps on the website showing real-time data from around the world. This data would also be made available using an API for art and research projects.
Potential legal problems could arise from broad patents and impinging on trade dress of other products held by larger companies. These however, may only become an issue when Temperamental has grown sufficiently and is better able to deal with them. Another potential threat is competition, but being first to market with this kind of product and being community driven this threat is somewhat negated.
I was determined to keep the branding clean and simple, whilst warm and appealing and felt that the designs I produced were a good reflection of the image I was trying to convey. The logo was able to put across the vague nature of the product to people who had not been told about it and with the slogan “The Complaining Robot” were almost able to get the full concept very quickly. Having spent my last year building websites I chose to create the basis of a site to show how the company’s visual style would be applied. Other examples of this are the letterhead and presentation slides. The branding uses orange on white and features sweeping orange curves. A brand identity guideline document would set out the precise dimensions, rules for scaling, margins, typography and colours.
The product design itself was also kept simple, I opted for a sphere as I wanted the device to be tactile and mostly featureless. I modelled the design in CAD software so that I could look at the design from all angles as I worked on it. I thought about and researched manufacturing processes that could be used to achieve the form and finish I wanted. I looked at various mechanisms and how comparable products are assembled as well as the various companies that manufacture them. The product would be made with a complete product life cycle in mind, including ensuring that parts are recyclable and environmental impact during manufacture, distribution and eventual disposal are considered.
I felt that my 2 minute pitch went well and I was able to get useful feedback from it despite only having one week to make use of it before the 5 minute pitch with visuals. The 5 minute pitch the following week also went well but I had not managed to correctly pace the presentation and had to rush the end. Compared to the 2 minute pitch without visuals I think having to turn to both change slide and read the slides threw me off somewhat and I could have made better use of the prototype. Despite that I think both pitches were able to get across my idea effectively.
In-order to continue with this I would first get one or more prototypes built, then with a prototype I would be able to create a kickstarter. The kickstarter and related social media campaign would allow me to test interest in the product while only having invested the cost of the prototype and time spent creating assets. I would use the community feedback to improve the product and web service.
Overall I think the project was successful at least in terms of developing my abilities, both in product design and in key business skills such as pitching. In terms of the product and business I believe I could take it further, creating a successful business.